The optimum minimum flow velocity for solids transport in waste water pipes
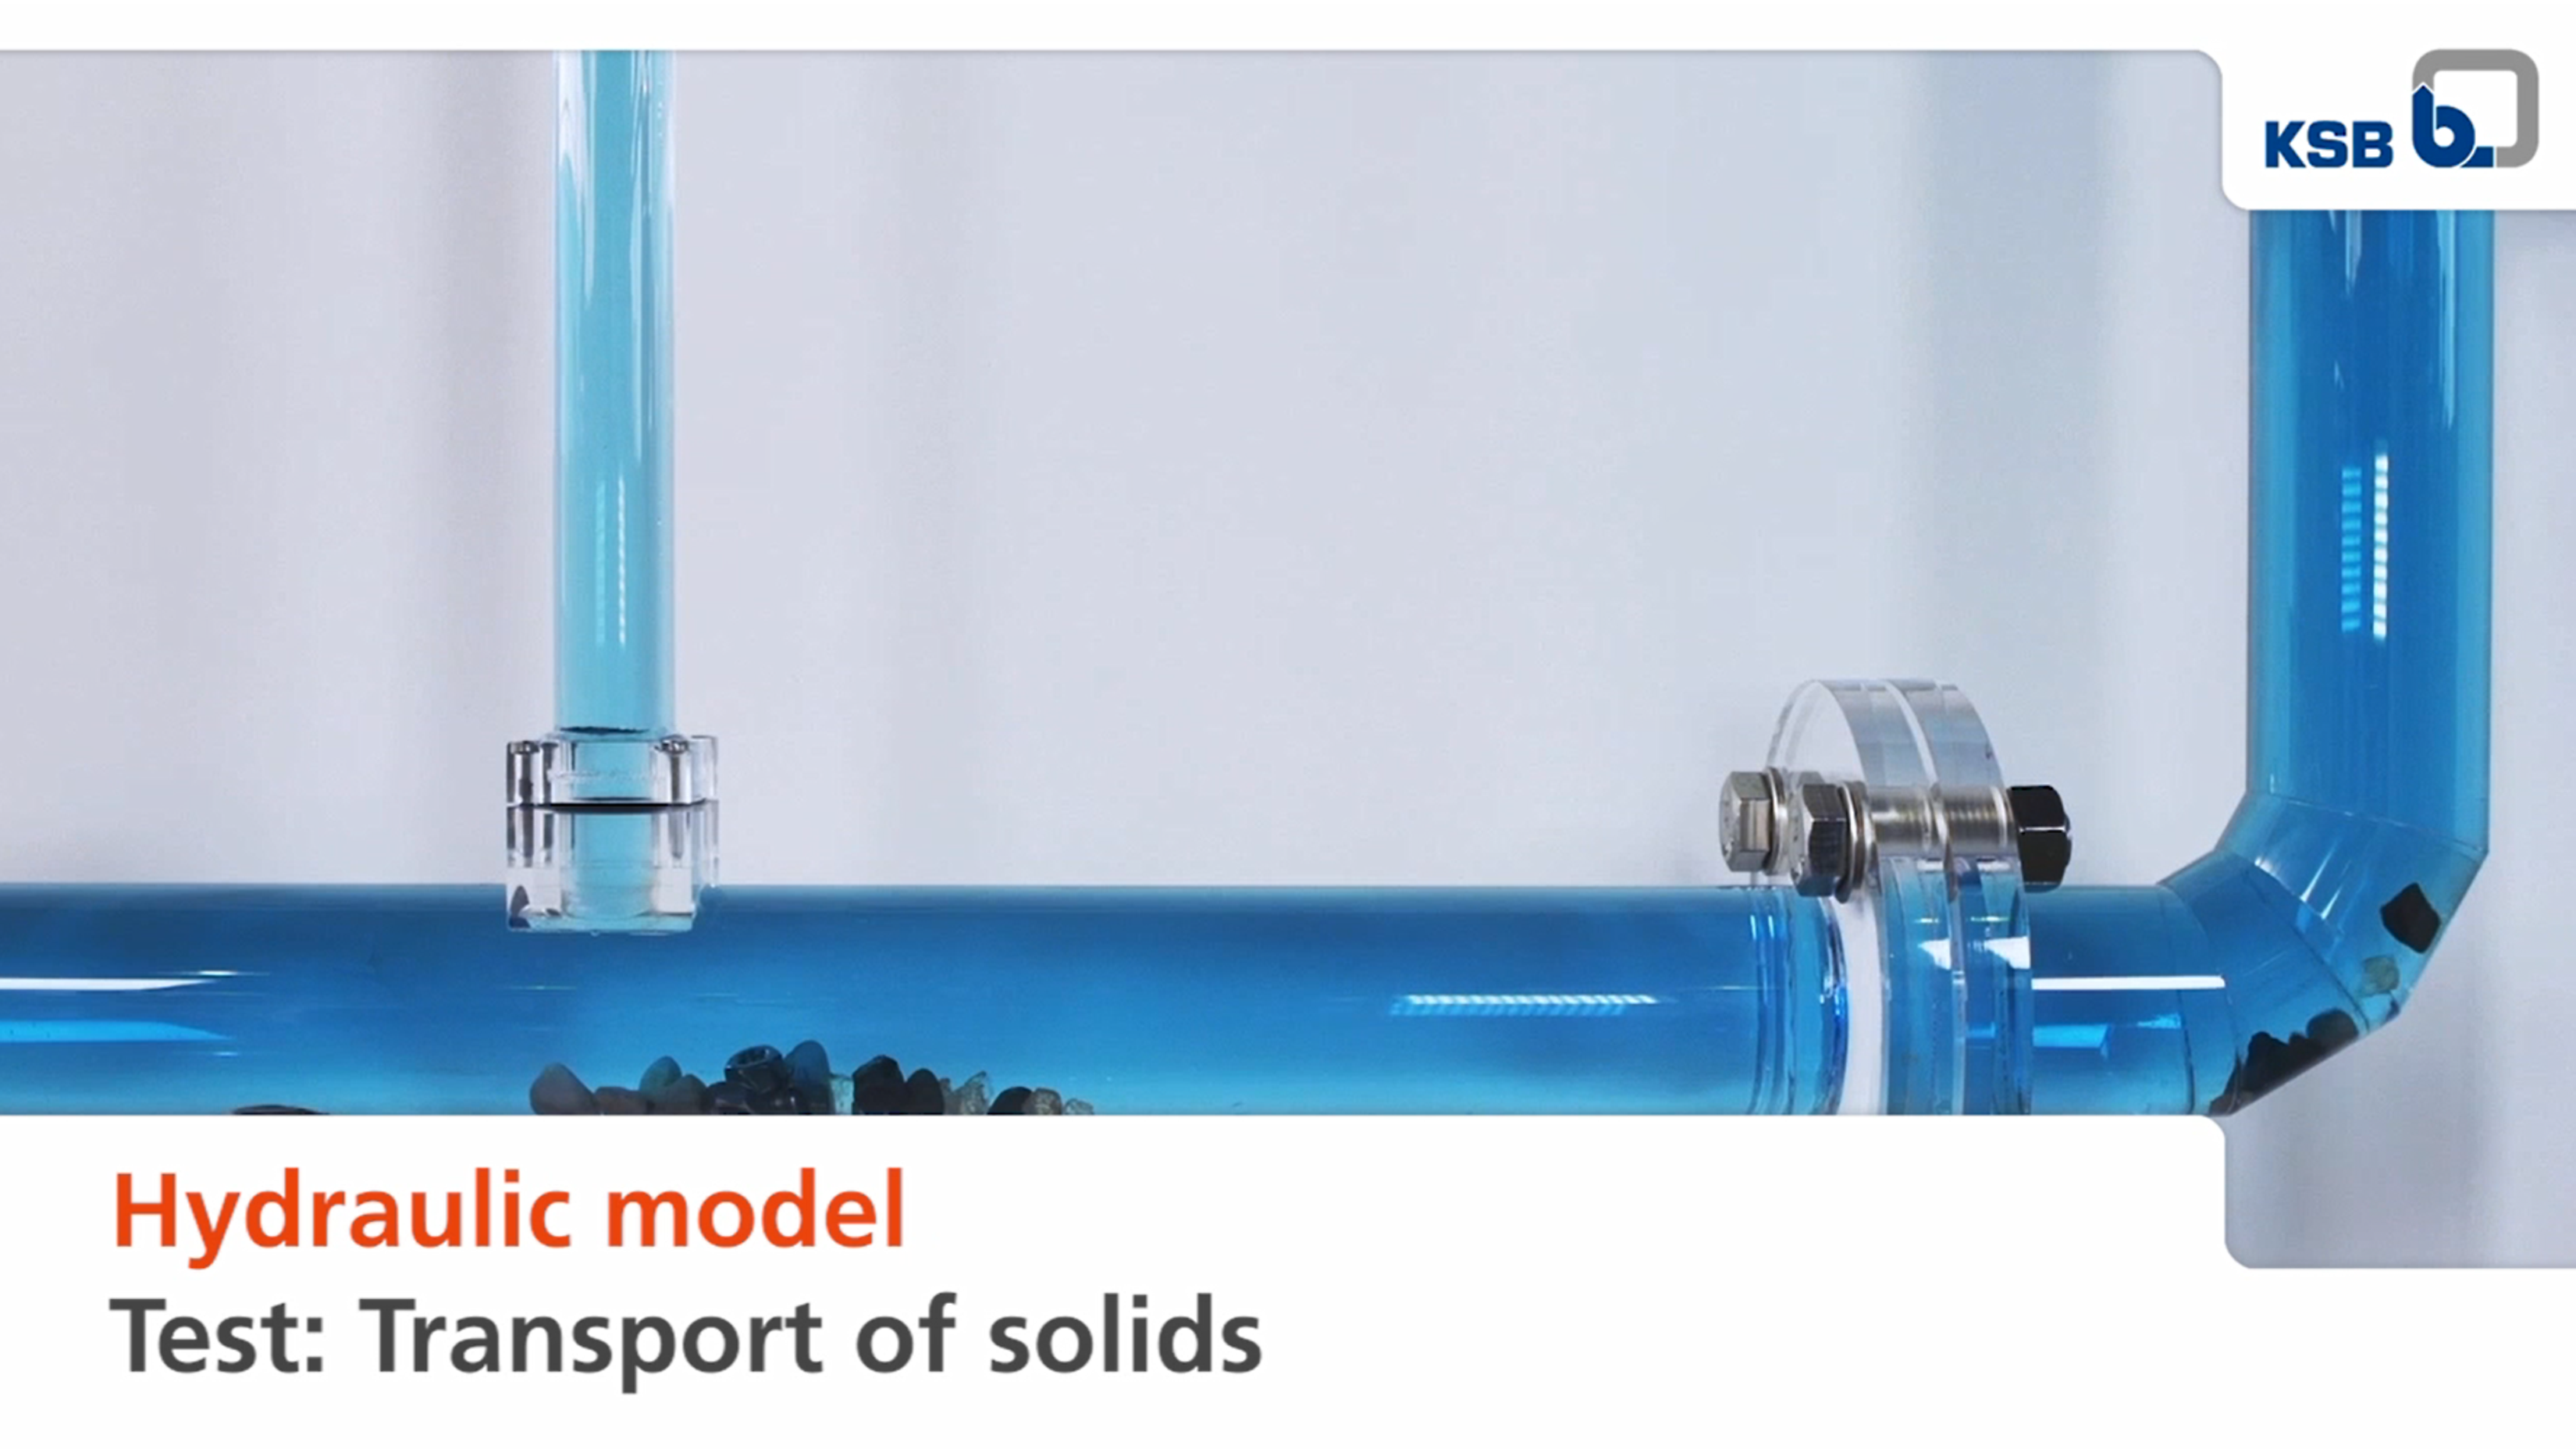
For the Solids Transport model testing, KSB has joined forces with the TU Berlin to investigate in greater detail the behaviour of various solids at different flow rates in pipes. The key element of the model test comprised a horizontal and a vertical pipe section. A pump in a water tank mounted at the back provided appropriate circulation of the fluid. The water was pumped back to the sump after the experiment was finished. Solids transported with the fluid were collected in a basket. The set-up was completed by gate valves and measuring equipment for setting the flow velocity.
Various solids typically found in waste water and of different densities, sizes and surfaces (e.g. stones, metal parts and glass splinters) were fed into the horizontal pipe via a feeder pipe. By opening the valve on the pump's discharge side, the flow velocity of the fluid was increased until the respective type of solid was transported by the fluid handled in the horizontal or vertical pipe section.
In the first part of the experiment, the behaviour of broken glass was examined at different flow velocities. The broken glass was introduced into the pipe and remained directly under the feeder pipe. The pump was then started up and the gate valve on the discharge side was slowly opened. The experiment started at a low flow velocity. At a flow velocity of 0.15 m/s, the solids did not move. It was then increased step by step. Above a flow velocity of approx. 0.4 m/s, the pieces of glass began to move. At a speed of about 0.5 m/s, the pieces of glass moved to the end of the horizontal pipe where it was ascending towards the vertical pipe. At about 0.7 m/s, the pieces of glass also moved upwards in the vertical tube and were transported though and out of the pipe.
In the second part of the experiment, the behaviour of round and smooth stones was examined at different flow velocities. Above a flow velocity of approx. 0.4 m/s, the stones started to move slightly. Above 0.45 m/s, the stones moved to the end of the horizontal pipe and remained in place where it became vertical. After the flow velocity was increased to 0.8 m/s, the stones then moved up the vertical pipe.
In the third part of the experiment, the behaviour of rough and angular stones under increasing flow velocity was investigated. At a flow velocity of 0.45 m/s, the first stones started to move. At about 0.5 m/s, the stones moved to the end of the horizontal pipe and remained in place where it became vertical. After the flow velocity was increased to 0.8 m/s, the rough and angular stones then moved up the vertical pipe.
In the fourth part of the experiment, the behaviour of small steel parts (bolts and nuts) at different flow velocities was investigated. At about 0.6 m/s, the first parts began to move. At a flow velocity of 0.9 m/s, all parts moved as far as the end of the horizontal pipe. At about 1.2 m/s, the first metal pieces moved upwards in the vertical pipe. Only at a flow velocity of 1.7 m/s were all other remaining metal parts also transported upwards in the vertical pipe.
In the fifth experiment part, the behaviour of a mixture of solids (consisting of stones, broken glass and metal parts) was investigated at different flow velocities. At a flow velocity of 0.4 m/s, the first solids started to move: Pieces of glass and stones detached themselves from the mixture. At about 0.45 m/s, broken glass and stones moved to the end of the horizontal pipe and remained at the bend to the vertical pipe section. At approx. 0.55 m/s, some parts of the broken glass were being transported up the vertical pipe. At about 0.7 m/s, all stones in the vertical tube moved upwards. At approx. 1.7 m/s, all metal parts remaining in the horizontal pipe were transported up the vertical pipe section.